Vorticity:
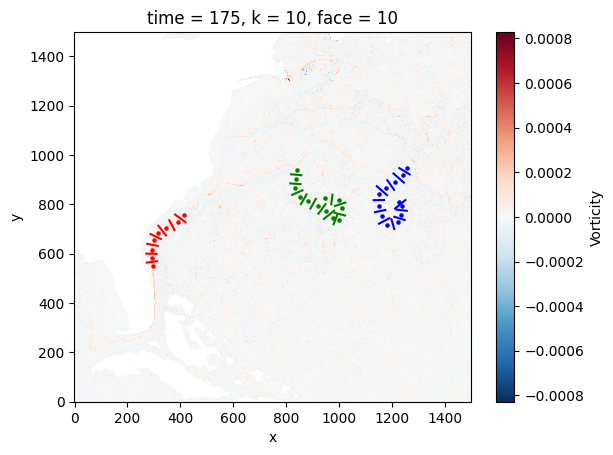
Marker 1:
Average: [5.638186187983198e-06, -4.549319009396761e-06, ...]
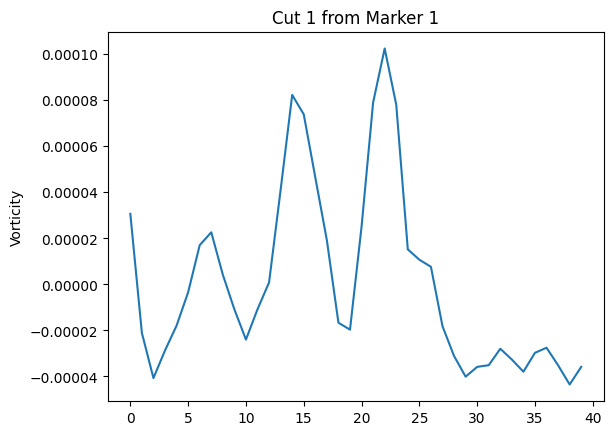
Cut 1:
x: [1227.0, 1228.0, ...]
y: [947.0398906795897, 946.3851846636708, ...]
Cut: [3.064511662147072e-05, -2.108520411035399e-05, ...]
Cut 2:
x: [1205.0, 1206.0, ...]
y: [924.9126362658944, 923.9739110532771, ...]
Cut: [-6.496774869836616e-06, -4.211406507406543e-05, ...]
Cut 3:
x: [1206.9596891937672, 1206.309226148353, ...]
y: [859.0, 860.0, ...]
Cut: [4.851223168612789e-05, 6.568156222022859e-06, ...]
Cut 4:
x: [1142.0, 1143.0, ...]
y: [873.4677072758241, 872.5328893481708, ...]
Cut: [1.0624932719534422e-05, -1.7340713871231476e-05, ...]
Cut 5:
x: [1130.0, 1131.0, ...]
y: [816.928193439454, 816.9477873243474, ...]
Cut: [1.824658592777327e-06, -4.074183799720612e-06, ...]
Cut 6:
x: [1135.0, 1136.0, ...]
y: [768.350157636458, 768.5791611661489, ...]
Cut: [-1.8419107504774716e-05, 7.373069648532619e-06, ...]
Cut 7:
x: [1150.0, 1151.0, ...]
y: [721.6148555059476, 722.1754317737499, ...]
Cut: [-5.43796083867831e-05, -1.8052897667673487e-05, ...]
Cut 8:
x: [1207.9163300986024, 1207.63953731332, ...]
y: [700.0, 701.0, ...]
Cut: [5.938002991466649e-06, 8.487971988552268e-06, ...]
Cut 9:
x: [1208.0, 1209.0, ...]
y: [749.5404120899095, 749.2073160467228, ...]
Cut: [2.780901087316179e-05, 1.897067967672879e-05, ...]
Cut 10:
x: [1216.0, 1217.0, ...]
y: [778.7958659202206, 778.6677520574565, ...]
Cut: [1.0114182567132255e-05, 6.821440361820552e-06, ...]
Cut 11:
x: [1211.0, 1212.0, ...]
y: [783.0614670958828, 783.9431919160832, ...]
Cut: [5.84740277753857e-06, 4.4032375220235424e-06, ...]
Click x: [1256.1760442401003, 1239.2101978391188, ...]
Click y: [946.4488230622965, 920.5351366313423, ...]
Width: [40, 40, ...]
Marker 2:
Average: [3.596420270621622e-06, -1.8122608112459536e-06, ...]
Cut 1:
x: [818.0, 819.0, ...]
y: [921.9735602966743, 921.8806032613664, ...]
Cut: [-2.3854030603670574e-05, -3.338951291688379e-05, ...]
Cut 2:
x: [815.0, 816.0, ...]
y: [885.0010519147554, 884.9241835970969, ...]
Cut: [-4.0050236549100496e-05, -4.436850851822926e-05, ...]
Cut 3:
x: [822.0, 823.0, ...]
y: [838.5205176272249, 838.9951794887661, ...]
Cut: [1.3282911374134496e-05, -1.3244920531839295e-05, ...]
Cut 4:
x: [855.1112603561728, 855.6545042182769, ...]
y: [801.0, 802.0, ...]
Cut: [-4.0799690485622394e-05, -4.2672563439830275e-05, ...]
Cut 5:
x: [891.2014768512981, 891.7245765032046, ...]
y: [783.0, 784.0, ...]
Cut: [4.664732871491569e-05, 5.608832571128991e-05, ...]
Cut 6:
x: [921.2149816268901, 921.9029713864627, ...]
y: [762.0, 763.0, ...]
Cut: [-5.37330568265046e-05, -4.278515530902409e-05, ...]
Cut 7:
x: [942.0, 943.0, ...]
y: [741.0552646728568, 741.9031455100596, ...]
Cut: [2.8027291009560326e-05, -1.6565485450125368e-05, ...]
Cut 8:
x: [978.6456283663592, 979.0058848222809, ...]
y: [719.0, 720.0, ...]
Cut: [3.8174205643066565e-05, 3.1512980822748045e-05, ...]
Cut 9:
x: [983.0, 984.0, ...]
y: [765.498733350222, 765.2211533142329, ...]
Cut: [4.0859114210965646e-05, 3.1034910408182654e-05, ...]
Cut 10:
x: [984.0, 985.0, ...]
y: [793.6806483280371, 794.022510056571, ...]
Cut: [1.3827932925489743e-05, 2.9042991058670423e-05, ...]
Cut 11:
x: [969.7811086866053, 969.8978584639873, ...]
y: [800.0, 801.0, ...]
Cut: [1.717885356360345e-05, 2.5412069241335555e-05, ...]
Click x: [840.0663377739227, 836.4945806368739, ...]
Click y: [939.3002199089296, 900.8764779595839, ...]
Width: [40, 40, ...]
Marker 3:
Average: [-9.411176942330454e-06, -8.091438390347457e-06, ...]
Cut 1:
x: [273.0, 274.0, ...]
y: [563.8839071560567, 564.0226971740512, ...]
Cut: [1.0978453541671701e-05, 1.1353578997431929e-06, ...]
Cut 2:
x: [271.0, 272.0, ...]
y: [600.2768505810393, 600.2505535249982, ...]
Cut: [3.5346703601916516e-06, 7.533265067501613e-06, ...]
Cut 3:
x: [275.0, 276.0, ...]
y: [639.9428051018353, 639.7286719312153, ...]
Cut: [8.915509008182714e-06, 6.873743194643022e-06, ...]
Cut 4:
x: [287.0, 288.0, ...]
y: [679.5097151090757, 678.9949303150597, ...]
Cut: [2.671615793733547e-06, 2.8630756094275458e-05, ...]
Cut 5:
x: [345.58200905573494, 344.8461911310584, ...]
y: [674.0, 675.0, ...]
Cut: [-4.1778961917094086e-05, -4.6256823643747964e-05, ...]
Cut 6:
x: [377.4499732921409, 376.9598284541523, ...]
y: [696.0, 697.0, ...]
Cut: [-4.544268193796919e-05, -4.606508674218019e-05, ...]
Cut 7:
x: [380.0, 381.0, ...]
y: [758.5959844318079, 757.8086665115482, ...]
Cut: [-4.75684344502953e-06, -8.49128060266732e-06, ...]
Click x: [295.3733743739903, 290.9086779526794, ...]
Click y: [550.5949234446186, 582.7636376347687, ...]
Width: [40, 40, ...]