Vorticity:
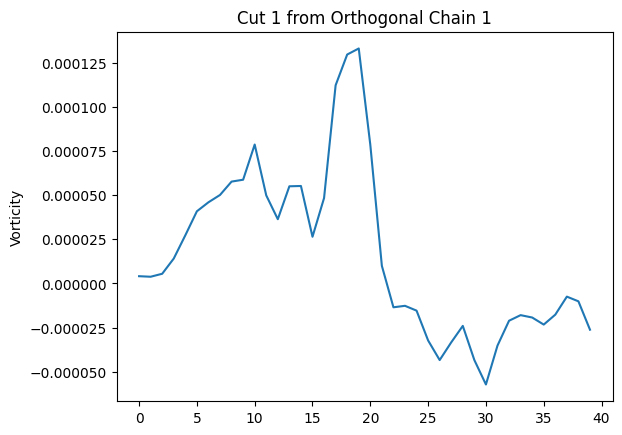
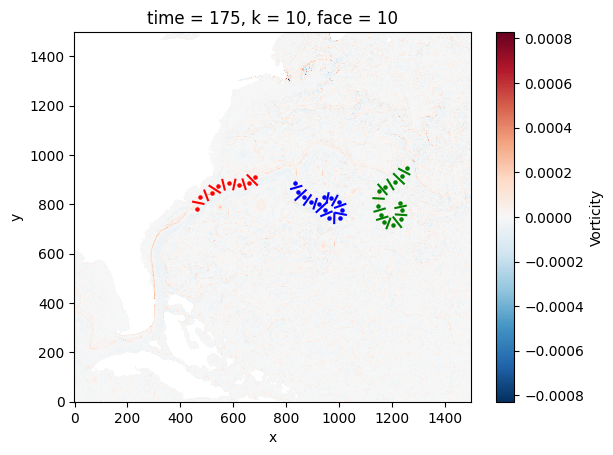
Orthogonal Chain 1:
Average: [-5.384873294488247e-06, -1.0483989319216648e-05, ...]
Cut 1:
x: [952.1830179101382, 952.3704869950517, ...]
y: [806.0, 807.0, ...]
Cut: [4.085727721118916e-06, 3.7812313769162205e-06, ...]
Cut 2:
x: [973.4482456383778, 973.948163198147, ...]
y: [796.0, 797.0, ...]
Cut: [1.3868737420881005e-05, 8.443310959585394e-06, ...]
Cut 3:
x: [984.0, 985.0, ...]
y: [786.4991971458151, 786.8776379216832, ...]
Cut: [2.780286493829907e-05, 3.2852090453666086e-05, ...]
Cut 4:
x: [986.0, 987.0, ...]
y: [765.7096517715099, 765.5003149303735, ...]
Cut: [1.9630421222256992e-05, 1.9730021403655218e-05, ...]
Cut 5:
x: [980.865171405334, 980.8843990037866, ...]
y: [724.0, 725.0, ...]
Cut: [-1.2670396009372102e-05, 1.3547681545693076e-05, ...]
Cut 6:
x: [932.0, 933.0, ...]
y: [752.7119990545903, 753.1644546080518, ...]
Cut: [-3.0630338866699224e-05, -3.7033259219779596e-05, ...]
Cut 7:
x: [914.1801338207607, 915.1799689402991, ...]
y: [769.0, 770.0, ...]
Cut: [2.5452307580376126e-05, -3.424041767818268e-05, ...]
Cut 8:
x: [903.1445249220664, 903.4500300974809, ...]
y: [783.0, 784.0, ...]
Cut: [-4.025811135137767e-05, -6.126831338180062e-05, ...]
Cut 9:
x: [866.7517232431327, 867.4182799894916, ...]
y: [798.0, 799.0, ...]
Cut: [-3.2244373200203236e-05, -3.215873080655932e-05, ...]
Cut 10:
x: [834.3934141724822, 835.3932492920205, ...]
y: [818.0, 819.0, ...]
Cut: [-1.4559276781207842e-05, 7.527223496259124e-06, ...]
Cut 11:
x: [818.0, 819.0, ...]
y: [862.3608976107363, 862.6734491443774, ...]
Cut: [-1.971116891344275e-05, -3.650472066083602e-05, ...]
Click x: [942.9446691492644, 969.029712591498, ...]
Click y: [828.7373378652087, 823.847198641166, ...]
Width: [40, 40, ...]
Orthogonal Chain 2:
Average: [-4.670678875291174e-06, -6.396507285394932e-06, ...]
Cut 1:
x: [1226.0, 1227.0, ...]
y: [943.7974215534074, 943.2297603896051, ...]
Cut: [-1.7709521699255115e-05, 5.554648541609728e-06, ...]
Cut 2:
x: [1244.0175294763926, 1243.0521714299418, ...]
y: [884.0, 885.0, ...]
Cut: [-1.7965144651303517e-05, -9.549889651596925e-06, ...]
Cut 3:
x: [1204.4088372570252, 1203.8407491209239, ...]
y: [861.0, 862.0, ...]
Cut: [-2.0735575137060336e-05, -2.743301583360665e-05, ...]
Cut 4:
x: [1179.0376059446435, 1178.2300468096319, ...]
y: [841.0, 842.0, ...]
Cut: [-1.3428725221340155e-05, -2.46315497008459e-05, ...]
Cut 5:
x: [1129.0, 1130.0, ...]
y: [824.9770417841861, 824.9164257291769, ...]
Cut: [3.761077345011136e-07, 3.6510111755918798e-06, ...]
Cut 6:
x: [1133.0, 1134.0, ...]
y: [770.6411601605452, 770.9507350129136, ...]
Cut: [8.117093690775335e-06, -1.3622568285672395e-05, ...]
Cut 7:
x: [1143.0, 1144.0, ...]
y: [737.332117509019, 737.6557002732593, ...]
Cut: [-4.572401426780313e-06, 1.3355215710572375e-05, ...]
Cut 8:
x: [1178.8444197039717, 1179.1943619958101, ...]
y: [703.0, 704.0, ...]
Cut: [5.974160237438017e-06, -1.0462743829629225e-05, ...]
Cut 9:
x: [1233.6492315699484, 1232.9064969097199, ...]
y: [708.0, 709.0, ...]
Cut: [-3.079097925369664e-05, -3.420243951836959e-05, ...]
Cut 10:
x: [1214.0, 1215.0, ...]
y: [759.0317879096979, 758.9586051115771, ...]
Cut: [3.528159549285114e-05, 2.46671452462696e-05, ...]
Cut 11:
x: [1212.0, 1213.0, ...]
y: [785.0946306338327, 785.3299635532802, ...]
Cut: [4.075922605667558e-06, 2.3126060063328616e-06, ...]
Click x: [1255.2177696031708, 1237.0354321743287, ...]
Click y: [948.3874643008517, 916.3571994381778, ...]
Width: [40, 40, ...]
Orthogonal Chain 3:
Average: [-2.3205187886338526e-05, -2.118238542471462e-05, ...]
Cut 1:
x: [448.0, 449.0, ...]
y: [810.5275484955239, 810.3080001011613, ...]
Cut: [-1.5524649445054905e-06, 6.704382664950265e-08, ...]
Cut 2:
x: [504.309424814635, 503.9523408433713, ...]
y: [817.0, 818.0, ...]
Cut: [-4.62671081199205e-05, -4.0217057867633765e-05, ...]
Cut 3:
x: [510.0, 511.0, ...]
y: [874.9040330382295, 874.211611179086, ...]
Cut: [1.270051552004827e-05, -1.8245871374767539e-06, ...]
Cut 4:
x: [567.4012962105448, 567.1705650291129, ...]
y: [860.0, 861.0, ...]
Cut: [-2.8357602035619727e-05, -2.5429877722258247e-05, ...]
Cut 5:
x: [599.5658197243025, 599.7716681312663, ...]
y: [861.0, 862.0, ...]
Cut: [-3.17091789780703e-05, -3.3525411567154524e-05, ...]
Cut 6:
x: [646.2348867140697, 645.9446120019456, ...]
y: [862.0, 863.0, ...]
Cut: [-3.486491567643228e-05, -2.4854119433678275e-05, ...]
Cut 7:
x: [689.208726827993, 688.2958338927624, ...]
y: [879.0, 880.0, ...]
Cut: [-3.238556096986967e-05, -2.2492688071450278e-05, ...]
Click x: [463.256630469097, 473.3727030346263, ...]
Click y: [783.0291299428424, 829.1058621134416, ...]
Width: [40, 40, ...]
Vorticity_attrs:
global_metadata:
time_stamp:
user:
license:
file:
netcdf_attrs:
dim_attrs:
x:
y: